LNG Trade Just Stepped Up: 2025’s Biggest Export Jump in Three Years
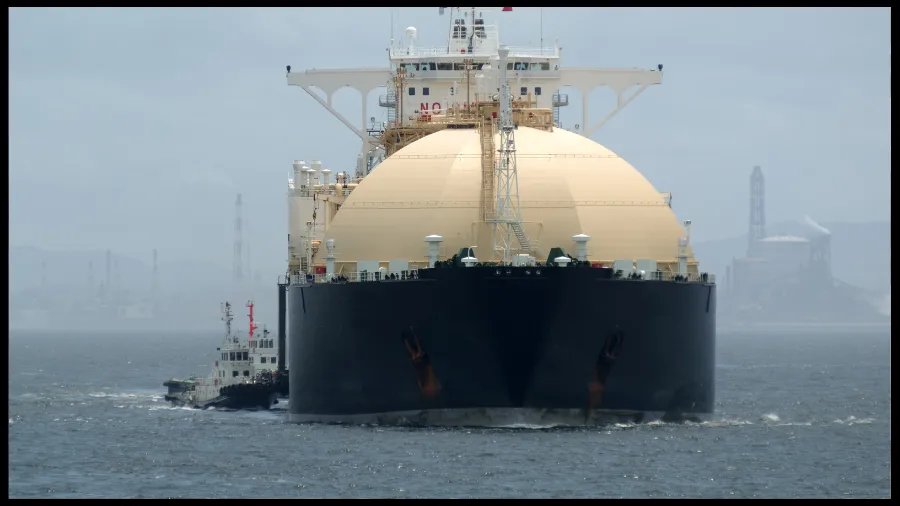
Global LNG exports in 2025 grew at their fastest pace in about three years, driven mainly by new North American supply ramping up. For shipping stakeholders, the key question is how much of that extra LNG turns into longer-haul voyages and steadier utilization versus a price-driven reshuffle that changes routes and seasonal peaks.
Subscribe to the Ship Universe Weekly Newsletter
Click here for 30 second summary
LNG exports jumped in 2025 and shipping feels it through ton-miles
Shipping-tracked estimates put 2025 global LNG exports at about 429 million tonnes, roughly 4 percent higher than 2024, described as the biggest annual gain since 2022. The extra volume was linked mainly to North American output ramping up, and the shipping impact comes down to where those incremental cargoes discharge and how smooth the loading calendar becomes.
-
Why the freight result can look bigger or smaller than the headline
If more Atlantic Basin cargo moves to North Asia, voyage lengths rise and vessel-days tighten. If more clears into closer markets, ships turn faster and the market can feel looser even with higher exports. -
What stakeholders watch next
Ramp-up projects can load unevenly at first. That tends to create short bursts of tightness around specific windows, then normalization once schedules stabilize. -
Commercial knock-on
More exports generally help utilization, but rate direction also depends on fleet growth and seasonal demand, not just annual tonnes.
2025’s export jump is a supportive demand signal for LNG shipping, but the real driver for earnings is whether incremental cargo adds vessel-days through longer routes and clustered loadings, or shortens voyages and frees up tonnage.
The 2025 rise was tied mainly to North American supply expanding and ramping. Coverage also pointed to specific ramp activity at LNG Canada and the Plaquemines project in the United States.
Shipping feels “volume” through vessel-days. Vessel-days increase when voyages are longer, when loadings bunch up, or when cargoes are re-traded and ships spend more time positioning.
| Shipping lever | Effect on vessel-days | Where it shows up |
|---|---|---|
| Destination mix and ton-miles | Longer average hauls absorb more days per cargo and tighten the market even if cargo count is steady. | Spot availability, ballast patterns, short-period rate firmness. |
| Ramp-up cadence | Early operations can be uneven, creating short windows where ships converge on the same load ports. | Waiting time, berth pressure, schedule reliability. |
| Prices and seasonal pull | When urgency fades, flows can become smoother and fewer rush cargoes hit the market at once. | Volatility profile of spot rates and prompt fixing. |
A market signal mentioned alongside the export jump
This tool helps translate a change in average voyage time across a set of cargoes into vessel-days and an equivalent number of ships on a 365-day basis.
Equivalent ships (365-day basis): 0.33
The 2025 export jump is a meaningful volume signal and the end-year momentum suggests a firmer run-rate than many stakeholders had a year earlier. For shipping, the practical question is whether incremental cargo adds vessel-days through longer routes and clustered loadings, or whether it shortens average voyages and frees ships back into the spot pool.
Global LNG exports growing faster in 2025 is a clear demand signal for maritime energy logistics, but the shipping impact will be decided by route length, loading smoothness, and how fleet supply lines up with those ton-mile needs. If the ramp-driven cadence stays uneven, stakeholders should expect periodic tightness around specific loading windows even in a broadly well-supplied year.
We welcome your feedback, suggestions, corrections, and ideas for enhancements. Please click here to get in touch.