Top 10 U.S. Policy Missteps that Shook Global Shipping in 2025
When shipowners talk about “policy risk” they usually mean sanctions or a warzone closing for a few weeks. In 2025 the United States added a new kind of risk to the mix with USTR port fees on China-linked ships, a policy that came into force for less than a month, threatened billions in extra cost for the biggest carriers, then was suddenly put on ice in a one year truce with Beijing. The result was classic whiplash for owners and charterers who had already started to reprice routes and rethink how often they want their tonnage anywhere near a U.S. berth.
Let's look at 10 big U.S. policy moves in 2025 and the accompanying fallout in maritime shipping.
⏱️ 2-minute summary: 10 U.S. moves and where they hurt
Use this as a briefing sheet. The table shows how each move hits P&L in the middle columns and how it feels in day-to-day decisions in the right column.
Bottom line: none of these moves is “just politics” for shipowners. Together they reshape port time, fuel burn, insurance, financing appetite and which voyages really make sense to fix.
1
Port Fees on Chinese-Built / Chinese-Owned Vessels
A one month rule that rewrote port-call economics, then went into a one year pause.
▼
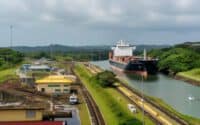
In October 2025, U.S. port service fees on China-linked ships moved from idea to reality, with large container and car carrier fleets suddenly facing much higher cost every time they called at a U.S. berth. Less than a month later the measures were paused for one year in a trade truce with Beijing. For owners and charterers it felt like a stress test of how quickly policy can flip the economics of a familiar rotation.
From mid October 2025, U.S. port service fees targeted ships that were Chinese owned or operated, most China-built vessels even under non-Chinese flags, and some foreign-built vehicle carriers. Early modelling suggested that if fully applied and escalated through 2028, the scheme could generate a multibillion dollar annual bill for the ten largest carriers calling U.S. ports.
For fleets with many China-built container ships, PCTCs or bulkers, a normal U.S. port call started to look like a tax event. Operators had to decide whether to absorb the fee, pass it through to cargo interests or reshuffle deployment so that different hulls took U.S. legs.
- Repricing of U.S. port calls for container, car carrier and bulk operators with China-built hulls in their portfolios.
- Extra legal and commercial work to unpack which ownership structures, flags and operators were actually caught by the “China linked” wording.
- Pressure from some cargo owners to avoid U.S. calls with China-built vessels, even where that meant less efficient tonnage on a route.
- Tougher conversations with financiers and lessors about how to treat a potential recurring fee that sits outside normal port cost assumptions.
In November 2025, Washington and Beijing agreed to suspend their port fee measures for one year as part of a broader trade understanding. The pause arrived just as operators were starting to bake the new charges into contracts and network planning. The rule is not gone it is parked until late 2026 unless a more permanent deal emerges. The signal to the market is that similar measures can be switched on again if relations worsen.
- How U.S. China trade talks deal with the underlying Section 301 case on shipbuilding and logistics rather than just pausing fees at the port gate.
- Whether other jurisdictions copy the idea and start testing their own “China linked” port surcharges or restrictions.
- New charterparty wording that shifts the risk of any revived fees explicitly to owners, even for voyages that do not yet trade to U.S. ports.
2
Tariff Whiplash and “Trade War 2.0”
Stop–start tariffs that turn cargo flows into a series of rushes and slumps.
▼
For most shipowners, the “trade war” is not a headline it is a scheduling problem. 2025 has been another year of tariff threats, new duties on strategic goods, and then partial rollbacks or waivers when the political temperature changes. The result is front loaded cargo when shippers race to beat a deadline, followed by thin volumes that leave ships under-employed and freight curves hard to read.
Tariffs on a wide range of Chinese goods, higher duties on steel, aluminium and clean-tech products, plus recurring threats of new lists have turned U.S.–Asia trade into a moving target. Companies pull forward imports ahead of tariff hikes, then cut back once the higher duties land or when a temporary reprieve is announced.
Instead of steady contract cargo, owners see surges of boxes and bulk parcels before a tariff date, clogged terminals when everyone rushes at once, and then much quieter booking windows afterwards. That stop–start pattern is hard on voyage planning, charter coverage and bunker buying, especially on long-haul Asia–U.S. lanes.
- Volatile utilisation on key trades as pre-tariff cargo rushes give way to soft volumes and emptier sailings.
- More short-term fixtures and last-minute changes in cargo mix, which make it harder to optimise stowage, fuel and speed.
- Extra commercial work to reprice contracts that suddenly include an unplanned tariff element in the shipper’s landed cost.
- Higher risk that shippers shift volume away from U.S.-bound routes entirely, favouring regional supply chains that bypass long deep-sea legs.
The current phase is less about one dramatic tariff wave and more about repeated, targeted changes: clean-tech products one month, strategic metals the next, and new talk of levies on specific categories of Chinese imports. Each move is smaller than the first tariff shock years ago, but taken together they keep owners guessing about where long-term trade flows will settle.
- Whether tariff “mini deals” between the U.S. and key partners are extended, rolled back or allowed to lapse quietly after an election cycle.
- How much manufacturing genuinely re-shores or near-shores away from China, reshaping long-haul container and bulk flows over several years.
- Which customers are locked into U.S.-exposed supply chains and which are already diversifying, so that future contract discussions and fleet deployment reflect that split.
3
Protectionist Maritime Industrial Push Without Clear Transition
Trying to rebuild U.S. maritime capacity while the fleet still depends on cheaper yards abroad.
▼
Washington wants more ships, more shipbuilding and more maritime jobs on U.S. soil. The problem for owners is that this industrial push arrives while most competitive newbuild slots and repair yards sit in Asia and while existing U.S. yards are small, busy and expensive. Policy signals say "rebuild the industry at home", but there is no clear transition path that explains who pays the premium and on what time frame.
New legislation and executive actions frame shipbuilding and key maritime infrastructure as a strategic sector. They lean on tools like Section 301 cases against Chinese shipbuilding, tax incentives for U.S. yards, buy American preferences and talk of stronger cargo reservation rules. In principle this supports domestic capacity, in practice it increases uncertainty for fleets that rely on a global yard market.
U.S. built ships cost more per compensated gross ton than equivalent builds from leading Asian yards. If policy pushes more traffic and more orders into the U.S. yard system without a clear subsidy or tax credit mechanism, part of that cost ends up with shipowners and part with cargo interests that rely on U.S. routes. The real question for boards is who eats that gap and for how long.
- More questions from U.S. cargo interests and policymakers about why tonnage is built in Asia when domestic capacity is being promoted.
- Higher perceived political risk on using Chinese or other non U.S. yards for ships that will trade heavily to or from the United States.
- Pressure in some tenders and contracts to show a plan for using U.S. yards or U.S. controlled supply chains over the life of a vessel.
- More complex financing conversations if banks and export credit agencies see future rules that reward U.S. built ships and penalise others on U.S. routes.
Moving more work to U.S. yards takes years, not quarters. Yard capacity needs to grow, suppliers need to scale up and workforce gaps need to be filled. In the meantime fleets still need to order, drydock and retrofit in the global market. Policy that signals a fast shift without detailing a realistic transition plan leaves owners stuck between current cost reality and future political expectations.
- Whether concrete, bankable subsidies and tax credits appear that genuinely close part of the cost gap between U.S. and non U.S. yards for selected ship types.
- How far future cargo reservation or preference schemes go in linking access to certain U.S. trades with U.S. built or U.S. controlled tonnage.
- Signals from lenders and charterers about valuing U.S. built ships differently on U.S. routes, which would change how newbuild and retrofit pipelines are planned.
4
Opposition to the IMO Net Zero Framework
Pushing back on a single global fuel and carbon framework, keeping a patchwork in place.
▼
Many owners would prefer one clear global decarbonisation rulebook even if it is strict, rather than a mix of regional schemes that all work differently. The International Maritime Organization has been moving toward a combined approach that links a fuel standard with some form of greenhouse gas pricing. United States resistance to key parts of that package keeps the industry on a path where regional systems lead and global alignment stays slow.
Recent IMO work has focused on a net zero framework that combines a global fuel standard and a pricing mechanism for emissions from international shipping. The goal is to send a stable price and technology signal to the whole fleet. United States statements have raised concerns about the impact of global pricing on consumers and energy producers, signalling reluctance to commit to a single worldwide levy.
If large economies hold back from a strong IMO package, regional systems keep filling the gap. The European Union has already brought shipping into its emissions trading system and other regions are exploring their own measures. That creates a patchwork where a voyage can face different carbon rules and prices depending on which ports it touches and where a company is based.
- Compliance teams must track several different carbon regimes instead of one global scheme, each with its own reporting, verification and cost structure.
- Route planning and charter negotiations become more complex because the same ship can face higher or lower effective carbon costs depending on where it trades.
- Investment decisions on fuel and technology are harder because owners are trying to match one vessel to multiple overlapping standards instead of one clear global trajectory.
- Some cargo owners and financiers start to benchmark companies on how they handle this complexity, even though the rules themselves remain unsettled.
Without a strong IMO framework, every major region is tempted to design its own answer. That can mean separate reporting platforms, different definitions of well to wake emissions, and conflicting rules on which fuels qualify as low carbon. Companies that operate globally end up paying more in systems, staff time and opportunity cost just to keep track of overlapping expectations.
- Whether the United States and other large economies can accept a global pricing and fuel package at IMO or continue to favour regional approaches.
- How quickly new regional schemes emerge in Asia and the Americas and whether they align with or diverge from the European model.
- Signals from charterers, banks and cargo owners about which carbon metrics they will treat as decisive when they allocate business and capital over the rest of the decade.
5
Overlapping U.S. Climate Rules Without Integration
State, federal and port level rules that add cost without a clear, joined up pathway.
▼
Ships calling the United States now face a stack of climate related rules that grew from different places and on different timelines. California tightens its at berth requirements, federal proposals target fuel carbon intensity, and some ports add their own conditions. Each measure may be rational in isolation. Together they form a puzzle that owners must solve without a single, integrated plan that says where U.S. climate policy for shipping is heading.
California has extended its at berth regulation to cover more ship types and more terminals, pressing operators toward shore power or equivalent emission reductions during calls. At the same time federal proposals such as the Clean Shipping Act concept point toward tighter fuel carbon intensity standards for ships that serve U.S. trade. Individual ports explore extra conditions and incentives on top of these layers.
There is no single roadmap that explains how state rules, federal climate policy and port level initiatives are meant to line up over the next five to ten years. Owners must plan for at berth power investments, future low carbon fuel obligations and possible federal pricing or reporting schemes without a consolidated U.S. timetable or clear division of roles.
- Extra capital and operating spend to meet California and other state requirements at selected ports, while still fitting the same ship into very different regimes elsewhere.
- Higher complexity in voyage planning and contract clauses because compliance obligations can change from one U.S. port to the next.
- Difficulty explaining a clear U.S. climate cost per voyage to cargo owners, since rules are layered and not yet synchronised.
- More internal time spent every year on tracking regulatory updates rather than on improving the physical performance of ships.
Crews and shore teams must juggle different checklists and technical configurations for the same vessel. A ship that can plug in and comply easily in one California port may face different expectations a few days later at a Gulf or East Coast terminal. That patchwork increases the risk of mistakes, last minute workarounds and unexpected delays tied to climate rules rather than to the cargo itself.
- Whether federal policy will eventually set a clear, national framework that pulls state and port rules into a more consistent structure.
- The pace at which ports invest in shore power and related infrastructure, since uneven rollout makes planning much harder for deep sea fleets.
- How cargo interests and financiers respond whether they reward early movers that invest in compliance and performance or treat all routes to the United States as interchangeable.
6
Red Sea / Gulf Security: Reactive, Not Predictable
Naval responses, ceasefires and new threats that change route economics every few months.
▼
Since late 2023, owners have watched the Red Sea, Bab el Mandeb, Gulf of Aden and the wider Gulf swing between high threat and partial calm. Houthi attacks on commercial shipping, a large U.S. led naval response, Iranian seizures in the Strait of Hormuz and periodic pirate incidents have all pushed fleets to reroute via the Cape or accept higher war risk exposure. For many operators the pattern feels reactive rather than settled, which makes long term planning difficult.
Houthi attacks on merchant ships in the Red Sea and Gulf of Aden triggered a multinational naval operation that ran through early 2025, with repeated airstrikes on launch sites and escorts for some transits. A ceasefire with the United States reduced direct attacks on U.S. linked shipping, while threats to other traffic persisted. Later in 2025, Houthi statements about suspending some maritime attacks were followed by ongoing piracy risks in Bab el Mandeb and new tension around Iranian actions in the Gulf and Strait of Hormuz.
At various points, war risk premiums for Red Sea and Gulf voyages have doubled or more, and many deep sea services have diverted via the Cape of Good Hope, adding roughly ten to fifteen days to Asia Europe rotations. Underwriters have rewritten listed war zones, some have paused cover for specific legs, and rates in the Middle East Gulf have jumped after vessel seizures or high profile attacks. The net effect is a moving target for both insurance cost and voyage duration on routes that once felt routine.
- Frequent switches between Suez and Cape routings, which disrupt schedules, raise bunker and carbon cost and complicate crew planning.
- War risk and additional premiums that can change voyage by voyage as underwriters respond to each new attack or incident.
- More complex fixture negotiations around war clauses, safe port wording and who pays if a service has to divert or wait out a spike in risk.
- Rising fatigue and pressure on bridge teams transiting high threat areas, especially when guidance from different flag states, navies and insurers is not fully aligned.
Naval coalitions surge after major attacks, then scale back once a ceasefire or lull sets in. Rules of engagement, convoy practices and recommended routing are updated in bursts rather than through a stable, long term scheme. For commercial operators that means each season brings a new pattern of warnings, military presence and insurance conditions, rather than a predictable corridor framework they can build into multi year contracts.
- Whether a more durable security architecture emerges for Red Sea and Gulf traffic, with clear expectations on naval protection and information sharing.
- How insurers redraw war risk areas and pricing for Red Sea, Bab el Mandeb, Gulf of Aden and Strait of Hormuz trades over the next renewal cycle.
- The point at which shippers and charterers treat Cape routings and longer transit times as normal for some trades, rather than as a temporary response, which would lock higher cost into long term contracts.
7
Sanctions and High-Profile Tanker Seizures
Turning compliance risk into route risk whenever a crude or product tanker nears a hotspot.
▼
Sanctions are no longer only a background legal issue that compliance teams handle. Each time a crude or product tanker is boarded, diverted or seized under a sanctions related dispute it sends a signal to the whole market. Owners see that even compliant tonnage can be delayed or questioned if cargo origin, destination or ownership structures are not crystal clear. That raises the perceived risk of trading through certain regions or with certain counterparties.
United States and allied sanctions now touch Iranian, Russian and Venezuelan oil flows as well as a growing list of entities linked to so called shadow fleets. Designations can arrive quickly for ships that switch off AIS, conduct suspicious ship to ship transfers or carry cargoes from heavily sanctioned origins. Financial sanctions reach into insurance, banking and even basic services such as classification and port agency support.
Periodic tanker seizures and diversions in the Gulf and other choke points show how fast sanctions can move from paperwork to physical enforcement. Vessels have been boarded due to alleged links to sanctioned cargoes, ownership or previous dealings, sometimes after they have already loaded. Even when ships are eventually released, days or weeks can be lost and reputations damaged with charterers, banks and insurers.
- Fewer owners are willing to touch trades that are even close to sanctioned flows, which tightens available tonnage and lifts freight for some routes.
- Compliance checks on charterers, cargoes, ship to ship plans and documents take more time, which can delay fixture decisions and loading windows.
- Seizure risk is now priced into some routes and cargo types, raising insurance cost and pushing owners to demand clearer contractual protection.
- A single mistake or weak screening step can lead to detainment or blacklisting that affects a ship far beyond one voyage or one charter.
Even owners that avoid sanctioned trades still feel the pressure. Banks and insurers scrutinise portfolios more closely, some reduce appetite for older tonnage, and counterparties ask for stronger warranties on past and future compliance. That raises the cost of capital and narrows employment options for ships that spend much time in higher risk regions, especially in and around the Gulf and certain transhipment hubs.
- How strongly United States and allied authorities enforce price caps, tracking rules and AIS expectations for tankers trading near sanctioned cargo flows.
- Whether new waves of designations hit service providers such as insurers, class societies and smaller financiers that still work with higher risk fleets.
- The degree to which mainstream banks and charterers distance themselves from any vessel with a sanctions history, which can permanently split the tanker market into two tiers.
8
The Jones Act Status Quo in a Higher-Cost World
An old law that keeps coastal shipping expensive just as global supply chains need flexibility.
▼
The Jones Act has framed U.S. coastwise trade for more than a century by requiring ships to be U.S. built, U.S. flagged, U.S. owned and U.S. crewed for domestic legs. In a world of rising interest rates, high shipyard costs and pressure on consumer prices, that status quo looks more expensive every year. For shipowners and cargo interests that depend on U.S. coastal, Alaska, Hawaii or Puerto Rico trades, the law is a permanent design constraint rather than a background rule.
The Jones Act reserves coastwise movements of cargo for vessels that meet four tests: U.S. built, U.S. flagged, at least 75 percent U.S. owned and mostly U.S. crewed. Waivers are rare and usually tied to national emergencies. In practice the law limits competition on many domestic routes and supports a small, higher-cost U.S. fleet and shipyard base that does not scale easily when demand spikes.
U.S. built tonnage typically costs far more than equivalent ships from competitive Asian yards. That higher capital cost has to be recovered through freight rates on a smaller number of eligible vessels. When disruptions hit international trades, the Jones Act fleet cannot be easily supplemented by foreign tonnage, which limits flexibility and keeps domestic freight structurally higher than many comparable short sea markets.
- Newbuild decisions for Jones Act trades carry high entry costs, long lead times and relatively few yard options, which raises project risk.
- Domestic sea freight can be expensive enough that some cargo moves by road, rail or even import routes rather than coastwise shipping, reducing overall maritime volumes.
- Regions such as Alaska, Hawaii and Puerto Rico feel higher landed costs when the small Jones Act fleet is tight or when fuel and financing costs jump.
- Charterers have fewer levers to adjust capacity quickly when demand spikes or when international supply chains shift, because non compliant ships cannot simply be dropped into a coastal leg.
The global environment has moved to higher interest rates, more volatile fuel prices and new decarbonisation requirements, but the Jones Act framework has stayed largely unchanged. That means each new cost layer on ships and infrastructure falls on a small, protected fleet instead of being spread across a competitive market. The law may meet security and political goals, but it amplifies cost pressures precisely when logistics budgets are already tight.
- Whether any practical reforms emerge, such as targeted waivers, tax credits or financing support that reduce the cost gap for new Jones Act tonnage.
- How political debates evolve after major storms, supply disruptions or price spikes, when the impact of high domestic freight costs becomes more visible.
- The extent to which cargo owners continue to accept higher domestic shipping cost or accelerate moves toward alternative routing and sourcing that bypass some Jones Act legs altogether.
9
Tariff Threats on Chinese Port Cranes Stalling U.S. Port Upgrades
Security alarms around Chinese-made ship-to-shore cranes that freeze capex decisions at the quayside.
▼
Large Chinese builders have supplied a big share of the ship-to-shore cranes at U.S. ports, especially on container berths. Security concerns about remote access, software and data handling have triggered new scrutiny and talk of tariffs, restrictions or incentive schemes to source cranes from alternative suppliers. Until there is a clear line of sight on rules and support, some ports hesitate to order or replace equipment, which slows down capacity and productivity upgrades that shipowners rely on.
U.S. agencies have raised concerns that some Chinese-made cranes could be used to collect data on port operations or be vulnerable to remote interference. In response, Washington has talked about tighter controls, tariffs and funding to help ports source alternative equipment. That puts current and future crane orders under a cloud, especially where existing fleets are heavily Chinese-built.
Port authorities and terminal operators do not want to invest in cranes that might be hit by new tariffs or restrictions a few years later, but alternative suppliers have longer lead times and higher prices. The result is a pause in some upgrade plans. Cranes stay in service longer than planned, orders are delayed, and berth productivity improvements that depend on new gear are pushed to the right.
- Ports delay decisions on new cranes or major refurbishments while they wait for clarity on tariffs, security standards and funding support.
- Older cranes stay in front line service longer, which can limit outreach, lift height and reliability on the biggest ships.
- Terminal operators face a more complicated supplier landscape, with more design and software diversity and less scope for standardised spares and training.
- Owners arriving with high stack, wide beam ships have to plan around slower or less predictable crane performance at some U.S. ports.
Every year that port crane fleets fall behind the ships they serve, call times are harder to predict. A few extra hours alongside per call, repeated across a loop, can erase the gains from slow steaming or careful network planning. When owners talk about port bottlenecks in the United States, stalled crane upgrades are an important part of that story, even if the root cause sits in national security debates rather than port engineering.
- Whether the United States sets clear long term rules for security, tariffs and data handling on quay cranes so ports can order with confidence.
- How fast non Chinese crane suppliers can scale up production, support and digital systems for North American ports.
- Which ports move early to modernise their crane fleets despite uncertainty, and which fall behind, since that will affect schedule reliability and preferred calls for large ships.
10
Constantly-Shifting Timelines for Maritime Tax / Subsidy Regimes
Grants and tax credits that move on political calendars, not fleet renewal calendars.
▼
U.S. policy offers a growing mix of grants, tax credits and infrastructure programmes that touch ports, shipyards, alternative fuels and clean power. For owners and terminal operators, the problem is not only the rules; it is the timelines. Funding windows, credit sunsets and eligibility criteria tend to shift with budget cycles and elections rather than with the long life of ships and terminals. That makes it difficult to anchor twenty to thirty year maritime projects on support that may move every two to four years.
Recent U.S. packages have introduced or expanded support for port electrification, shore power, clean fuel production, shipyard upgrades and low emission vessels. These often come as grant competitions, time limited tax credits or pilot schemes with fixed allocation periods. Each has its own application rules, deadlines and review cycles.
Support levels, eligible technologies and deadlines can be revised when administrations change or when budgets are renegotiated. Credits that looked generous when a project was conceived can be scaled back or allowed to expire, and new programmes may prioritise different regions or technologies. For maritime projects that take years to design and build, this moving target turns policy support into something closer to an upside option than a firm pillar in the business case.
- Project sponsors are forced to build multiple financial cases: one with support, one without, and sometimes a third that assumes partial or delayed support.
- Some viable retrofit or newbuild concepts are shelved because management teams are not sure the promised tax or grant component will still exist at commissioning.
- Smaller owners and regional ports struggle to keep up with evolving rules and deadlines, which favours players with larger policy and grant teams.
- Banks and lessors discount policy incentives heavily in their models unless they see clear, long dated commitments written into law and guidance.
When deadlines are tight or sunset dates approach, owners and ports rush to fit projects inside the eligibility window, even if the design is not fully optimised. In other years, investment pauses while everyone waits to see what the next round of support will look like. Over time this on–off pattern can leave fleets and terminals with equipment choices that reflect grant calendars more than long term performance, and with gaps where good projects missed their funding window.
- Which tax credits and grant schemes have genuine multi year backing across parties, rather than depending on a single administration or narrow budget deal.
- Opportunities to structure projects so they still make sense on pure economics, with policy support treated as an upside rather than a requirement.
- Early signals that key programmes will be extended, scaled back or repurposed, so that pipeline projects can be brought forward or delayed with eyes open.
What These 10 U.S. Moves Cost Your Fleet
Plug in your own per-ship estimates to see how port fees, tariffs, security risk and policy friction stack up in dollars. Use it for a single trade, a fleet segment or a rough global scenario. All numbers are your inputs this tool just does the math.
- Use simple ballpark figures per ship per year, then refine later.
- Run separate scenarios for different trades, segments or timeframes.
- This is a structured way to talk about policy cost, not a forecast.
We welcome your feedback, suggestions, corrections, and ideas for enhancements. Please click here to get in touch.