After two years of disruption, shipowners are now juggling a mixed picture at the key Middle East chokepoints. The Red Sea and Suez are seeing a clear rebound in traffic, even though Houthi attacks and war risk classifications have not gone away. At the same time, the Strait of Hormuz remains open but is under heavier political and insurance pressure, with higher premiums and recent incidents pushing some tankers to slow or rethink Gulf exposure. Alternatives like the Cape of Good Hope route are still in play, but they come with longer transit times and much higher fuel and time costs that owners must weigh against security risk.
Click here for 30 second summary
Simple Summary in 30 Seconds
Red Sea attacks have turned Suez from a simple shortcut into a high risk corridor. Some services are returning through the canal as volumes and revenue recover, but many owners still run via the Cape to avoid war risk premiums and security exposure. Tankers and gas carriers in the Gulf cannot bypass the Strait of Hormuz, so they price that risk into every voyage. The result is a trade lane map where routing, insurance and contract wording now matter as much as speed and fuel cost.
🚨 What changed
Missile and drone attacks in the Red Sea pushed many ships away from Suez and lifted war risk premiums. In parallel, Suez traffic has started to recover as some carriers test a return, while insurers still treat the area as high risk. Hormuz remains a flashpoint for Gulf oil and gas moves, so conflict headlines there feed straight into freight and cover pricing.
🧭 Routes owners are actually using
Asia to Europe strings now split between shorter Suez runs and longer Cape of Good Hope loops that avoid high risk zones. Tankers and LNG carriers serving Gulf exports keep using Hormuz because there are few practical alternatives. Owners look at each voyage and decide whether the time saved through Suez is worth the premium and security footprint.
💰 Risk, cost and earnings effect
War risk add ons and security measures increase cash cost per transit, while Cape detours raise bunker burn and add days at sea. At the same time, longer routes and risk premia support higher freight on key trades when demand holds. Owners with flexible fleets and strong charter wording can turn this volatility into better day rates, while those on weak terms see more cost and stress than upside.
📌 Bottom line: Chokepoint exposure in the Red Sea, Suez and Hormuz is now a standing feature of the market, not a short term spike. Shipowners and charterers who treat routing, insurance and contract clauses as core levers rather than afterthoughts will protect margins and capture more of the upside when risk and freight move together.
Red Sea, Suez & Hormuz In Late 2025: Chokepoint Risk Versus Route Normalisation
Item
What has changed in late 2025
Business mechanics
Bottom line effect
Red Sea security picture
Since June 2025, security firms have logged more than one hundred maritime incidents in the wider region, with several dozen linked to Houthi activity. A small number of commercial ships have been hit, including sinkings and crew fatalities, which keeps the risk profile high even after ceasefire announcements.
Operators on exposed lanes treat the Red Sea as a high-risk corridor and build in Best Management Practice (BMP) procedures, routing advice, naval coordination, and in some cases armed guards or technical hardening.
📉 Higher operating cost and planning complexity on any service that uses Bab el Mandeb. 📈 Some support for freight rates if capacity avoids the corridor or slows down.
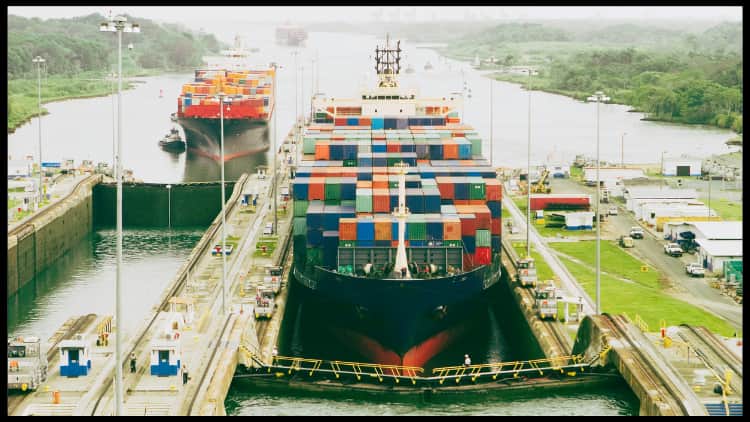
Suez Canal traffic and revenue rebound
Between July and October 2025, Suez revenue grew a little over 14 percent year on year, with ship transits and cargo tonnage both higher than the same period in 2024. October transits were reported as the strongest month since the Red Sea crisis began and the canal authority is actively inviting mainline carriers back.
More container and tanker services are trialling a return to Suez when charterers accept the risk and insurance terms. Canal rebates and targeted incentives are used to make the route more cost-competitive against Cape detours.
📈 Lower fuel burn, shorter transit times and better asset utilisation when Suez is used. 📉 Revenue upside for Egypt but owners remain exposed if a new incident triggers another wave of diversions.
War risk premiums for Red Sea transits
After lethal attacks and ship losses in July 2025, additional war risk rates for Red Sea exposures jumped from roughly one third of a percent of hull value to about seven tenths of a percent, with some quotes closer to one percent on specific profiles. Market commentary in October still points to war risk quotes several times higher than pre-crisis levels.
Extra premium is usually priced for a seven-day window and paid per voyage. Owners and charterers negotiate how much of this cost is passed through via freight rates, surcharges or revised charter party clauses.
📉 Direct cash cost per transit that can run into hundreds of thousands of dollars on large hulls. 📈 Scope to recover some or all of the charge when markets are tight and competition is limited.
Strait of Hormuz risk and pricing
In mid 2025, confrontation between Iran, Israel and the United States included Iranian preparations consistent with mine activity and political threats to close Hormuz. Insurers responded with higher premiums for voyages in and out of the Gulf, although a later ceasefire softened some of the price spike. Even after that easing, cover for the area is still more expensive than in early 2025.
Around a quarter of global seaborne oil trade and roughly a fifth of LNG volumes transit Hormuz, with limited practical alternatives. Tankers and LNG carriers generally keep sailing, but each flare up adds volatility to day rates and insurance.
📉 Higher baseline insurance and freight volatility on Gulf liftings. 📈 Potential earnings upside for owners positioned to load in the region when other players pull back.
Route choice Suez versus Cape of Good Hope
Even with Suez volumes recovering, a meaningful share of Asia to Europe and Asia to US East Coast cargo still moves via the Cape at the end of 2025. Industry commentary expects a gradual shift back to Suez rather than a full snap-back, as some shippers now price the Cape route as a normal option.
Cape detours add fuel consumption and around one to two weeks to round voyages on several key strings. They also raise ton-mile demand, which effectively tightens vessel supply and can support spot earnings when trade volumes hold up.
📉 Higher bunker bills and longer transit times for operators running the Cape. 📈 Stronger underlying rate environment if detours remain common and global demand does not weaken.
Contract structures and risk allocation
Late 2025 fixture notes show more explicit war risk and deviation language. Some charterers accept separate war risk premia and deviation costs, while others push for all-in rates with built-in corridor assumptions that can be repriced if risk levels change.
Commercial teams model both Suez and Cape scenarios and bake war risk pricing into their offers. Negotiations focus on who decides routing, who pays for extra insurance and how delays or forced deviations are treated.
📈 Owners with strong commercial teams can monetise complexity and protect margins. 📉 Poorly drafted clauses can leave owners carrying costs they cannot pass through.
Segment specific impacts
Container lines see schedule reliability and equipment balance as primary pain points, while tanker and LNG owners focus on day rate spikes, storage plays and positioning for any sudden disruption in Hormuz or the Red Sea shipping lanes.
Box carriers may redesign entire service networks, while tanker owners react more voyage by voyage. Dry bulk has a mixed picture that depends on trade lane and charter duration.
📉 Operational stress for schedules and crews that work near conflict zones. 📈 Trading opportunities for owners who can quickly redeploy tonnage into lanes where risk premia and rates are highest.
Notes: This table reflects developments and published data current to early November 2025. Conditions remain fluid. Owners should cross-check live routing advisories, insurance quotes, and charter party wording for each voyage.
📈 Positive Signals
📉 Negative Signals
Higher ton miles from Cape routing: longer voyages on Asia to Europe and Gulf related trades reduce effective vessel supply and can support spot earnings when cargo volumes are steady.
War risk and surcharge pass through: where market balance allows, owners can recover extra insurance and deviation cost through freight, bunker and risk surcharges.
Suez incentives and rebates: targeted discounts and loyalty programs from the Suez Canal can lower all in transit cost for owners that are willing to resume regular passages.
Premium pricing for reliable service: operators that maintain stable schedules through careful routing and risk controls can justify higher contract rates to cargo interests.
More value on flexible fleets: ships that can switch basins or trades quickly are better placed to follow pockets of high returns as risk and routing preferences shift.
Stronger role for commercial and legal teams: those who structure clear war risk, deviation and routing clauses can protect margins and turn complexity into a commercial edge.
Opportunities in niche services: convoy coordination, security consulting and specialised high risk area operations create new revenue streams for some operators and partners.
Data and monitoring advantages: owners that invest in real time tracking, risk scoring and advisory feeds can move earlier than competitors when the risk map changes.
Elevated war risk premiums: additional insurance for Red Sea and Gulf exposures remains several times higher than pre crisis levels and can cut deep into voyage margins.
Higher bunker consumption on detours: Cape of Good Hope routing increases fuel burn and extends round voyages, which raises cash outflows and ties up working capital.
Schedule reliability pressure: switching between Suez and Cape routes disrupts rotations, equipment balance and port windows, especially for container services.
Crew safety and welfare concerns: trading near conflict zones increases stress and incident risk, which can affect retention, training cost and union expectations.
Complex charter negotiations: disagreements over who pays war risk premiums and deviation costs can delay fixtures or force owners to accept weaker terms.
Sanctions and compliance risk: operating near sensitive states and entities raises the bar for screening cargoes, counterparties and ports, with heavy penalties for mistakes.
Financing and valuation impact: lenders and buyers may apply higher risk discounts to fleets that depend heavily on Red Sea and Gulf routes, which can affect leverage and sale prices.
Exposure to sudden policy shocks: new attacks, canal toll moves, naval advisories or sanctions packages can rapidly change routing economics and leave ships mispositioned.
Late 2025 Corridor View
Red Sea, Suez And Hormuz: Where The Risk And Time Really Sit
Snapshot of how owners are actually using each route today, what it costs in time and money, and how risk is being priced.
Red Sea And Suez
Gradual comeback, still a high-risk corridor
Suez revenue and transits have risen versus 2024 as more mainline services test a return, but volumes remain below a fully normal pattern.
Ships that use Suez accept shorter distance and time in exchange for higher insurance and security overhead in the Red Sea approaches.
Armed attacks and missile or drone strikes earlier in the year keep the area classified as high risk for many insurers and security firms.
Relative risk and usage late 2025
Risk
High
Usage
Rebuilding
Cape Of Good Hope Route
Default detour that feels almost normal
Asia to Europe and Middle East to Europe voyages that divert via the Cape typically add about 3,000 to 3,500 nautical miles compared with Suez.
This lengthens round trips by roughly one to two weeks on many lanes and raises bunker consumption and crew time at sea.
Several big carriers still treat the Cape as the standard plan on sensitive strings, with Suez as a selective option rather than the default.
Relative penalty versus Suez
Time
7–14 extra days
Fuel
Higher spend
Strait Of Hormuz
High value corridor that cannot be sidestepped
A large share of global crude oil and LNG still moves through Hormuz, with only limited practical alternatives for many export programs.
Episodes of confrontation in 2025 raised the risk premium for Gulf liftings and briefly pushed up war risk and freight quotes.
Even when tension eases, owners keep a margin in their pricing for the possibility of new flare ups or temporary disruptions.
Exposure for energy trades
Volume
Very high
Risk
Elevated
Late 2025 Trade Off: Suez Versus Cape On Asia–Europe Lanes
Illustrative relative levels. Suez keeps distance and fuel lower but carries Red Sea risk. Cape avoids the high risk area but adds days and bunker cost.
Via Suez
Via Cape Of Good Hope
Transit time
Baseline for planning
Around 7 to 14 extra days on many strings
Fuel and OPEX
Lower fuel use, canal tolls apply
Higher bunker burn and operating cost
War risk and security
High risk area premiums and extra measures
Lower war risk cost but more days at sea
Routing and risk language
Keep explicit wording on who decides route and when switches between Suez and Cape are allowed.
Separate war risk, deviation and bunker clauses so each cost has a clear home.
Build triggers that allow rate review when risk level or canal tolls change materially.
Voyage economics
Model both Suez and Cape legs on each lane, including extra days, bunker plan, and canal or war risk fees.
Use updated fuel prices and daily hire to see when Cape detours still make sense versus returning to Suez.
Track effective ton mile demand for your segment to understand how detours support or weaken rate levels.
People, partners and signals
Align internal guidance for masters and crews on when the company will or will not enter high risk areas.
Watch naval advisories, insurer circulars and large carrier routing decisions as early warning signals.
Keep charterers informed on risk controls and routing logic to support premium pricing and repeat business.
As we near the end of 2025, owners and charterers are no longer treating the Red Sea disruption as a short spike. Suez is slowly recovering volume, war risk premiums are still well above pre-crisis levels, and long Cape loops remain part of normal planning for many Asia to Europe strings. Detours typically add thousands of nautical miles and one to two weeks to round voyages, which lifts fuel consumption and ton mile demand at the same time. For energy trades tied to the Strait of Hormuz, the industry continues to price in confrontation risk because there are few realistic alternatives for that corridor. The net result is a market that rewards flexible routing, strong contract wording and disciplined risk pricing more than simple low cost transit.