15 Ways AI is Quietly Taking Over the Shipping Industry
January 20, 2026
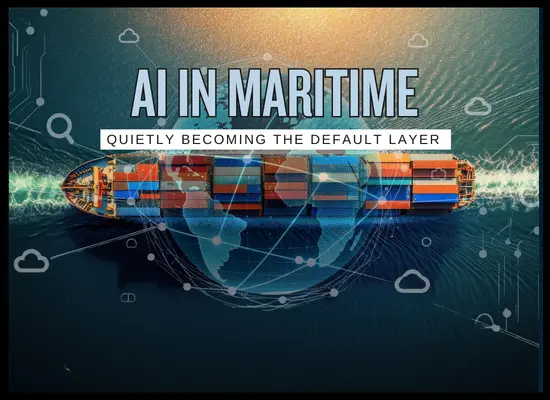
AI in shipping rarely shows up as a single “robot ship moment.” It shows up as quieter improvements to decisions that happen thousands of times a day: what the bridge notices, when maintenance is pulled forward, how ports plan a berth window, which emails get answered first, and which voyages get flagged for compliance risk. The takeover is mostly operational: AI is becoming the default layer that reduces uncertainty, compresses response time, and turns messy real-world signals into something a dispatcher, master, planner, or port operator can act on.
>> Maritime AI Savings Estimator <<
15 Ways AI Is Quietly Taking Over Shipping
| AI Development | How it works on the ground | Named proof point | Operational impact | Constraint to watch |
|---|---|---|---|---|
|
①
Electronic lookout and bridge decision support
Where it shows up: bridge watch; situational awareness; target detection support
|
Computer vision and sensor fusion help detect/classify objects and surface risk cues when workload spikes (darkness, glare, traffic density, fatigue). The bridge team stays responsible, but the system nudges attention to “what matters now.” | ABB Ability Marine Pilot Vision is described as a continuous electronic lookout that merges sensor data and performs risk assessment; DNV’s SAFEMATE program describes obstacle/threat detection and routing decision support for safe navigation. | Earlier risk recognition in cluttered waters; more consistent watch performance during high workload; fewer late “hard turns” that disrupt ETA/fuel discipline. | False alerts and trust calibration; procedures must keep humans accountable for COLREG decisions and escalation. |
|
②
Autonomous navigation functions going fleet-scale
Where it shows up: fleet retrofits; standardized navigation assistance across many ships
|
Moves autonomy from “pilot vessel” projects into repeatable fleet installs, which is where behavior actually changes: training, SOPs, and consistency of navigation support across crews. | January 2026 reporting and company announcements: Avikus (HD Hyundai) agreement with HMM to supply its AI-based autonomous navigation solution (HiNAS Control) for 40 vessels. | Less variance between crews in voyage execution; clearer baseline for safety and efficiency programs; autonomy becomes an operational layer, not a demo. | Integration complexity; measurable benefit depends on adoption discipline, sensor quality, and change management. |
|
③
Dynamic voyage planning: route and speed optimization
Where it shows up: voyage planning desks; onboard decision support; speed discipline
|
Optimization tools continuously recompute route and speed profiles using weather/sea constraints and ship performance baselines, turning “voyage plan” into a living plan instead of a static PDF. | NAPA Voyage Optimization product line describes planning optimal routes/speeds to cut fuel/emissions/cost; Wärtsilä Fleet Optimisation Solution describes use of cloud analytics, AI, and intelligent automation to optimize voyages. | Better fuel/ETA tradeoffs; fewer ad hoc speed changes; improved schedule recovery choices without burning extra fuel “just in case.” | Data quality and model tuning; commercial realities (berth uncertainty, late cargo, diversions) can override optimal profiles. |
|
④
Predictive maintenance for engines and auxiliaries
Where it shows up: planned maintenance windows; anomaly detection; fewer “surprise failures”
|
Sensor streams and service history feed models that flag abnormal patterns early, shifting maintenance from fixed intervals toward condition-based decisions and planned interventions. | Wärtsilä press release (Feb 18, 2025): Lifecycle Agreement with CMA Ships covering 14 large LNG-fuelled container ships, positioned to support operational reliability (with lifecycle/service tooling commonly tied to condition monitoring and predictive maintenance practices). | Reduced unplanned downtime; fewer breakdown-driven off-hire scenarios; maintenance spend shifts toward planned work instead of emergency response. | Sensor coverage gaps; model drift; benefits collapse if crews/vessels don’t close the feedback loop after alerts. |
|
⑤
Heavy-weather and roll-motion prediction
Where it shows up: heavy-weather routing; motion risk guidance; cargo safety decisions
|
ML models forecast short-term roll behavior and uncertainty, helping teams make earlier “avoid the setup” choices (speed/heading changes, route tweaks) instead of reacting after the ship is already in a bad motion regime. | Peer-reviewed example: “Deep Learning-Based Prediction of Ship Roll Motion with Explicit Epistemic Uncertainty Quantification” (Journal of Marine Science and Engineering, 2025). | Better warning windows for dangerous motion; fewer cargo-damage exposures tied to severe rolling; more disciplined heavy-weather decisions. | Safety-critical risk if wrong; requires conservative thresholds, strong validation, and clear human override rules. |
| AI Development | How it works on the ground | Named proof point | Operational impact | Constraint to watch |
|---|---|---|---|---|
|
⑥
Ports building “digital ports” and AI planning layers
Where it shows up: berth planning; traffic prediction; port-call coordination
|
Ports combine sensor/data infrastructure with AI to create an operational “digital version” of the port, enabling earlier planning decisions and better coordination around arrivals, departures, and shared constraints. | Port of Rotterdam publication: “Artificial Intelligence in the port,” explicitly describing building a digital version of the port to utilize AI. | Less wasted time at anchor; improved berth utilization; fewer last-minute changes that ripple into terminals, drayage, and warehouse labor. | Data-sharing barriers across stakeholders; plan-versus-reality gaps when operations deviate from forecasted events. |
|
⑦
Terminal safety monitoring with AI CCTV + asset tracking
Where it shows up: container terminals; near-miss prevention; hazard alerts in yards
|
Computer vision plus precise equipment tracking flags unsafe proximity, restricted-zone entry, and collision-risk situations, pushing real-time warnings to operators through control room dashboards or vehicle terminals. | January 2026 reports on Busan New Port (BNCT) and CyberLogitec: AI-enabled CCTV + RTK tracking deployment with full operation targeted for August 2026. | Fewer incidents and near-misses; less disruption from safety stand-downs; stronger “run steady” performance in peak windows. | Alert fatigue; camera placement and integration quality; governance and labor acceptance. |
|
⑧
Container OCR at gates and cranes
Where it shows up: truck gates; STS cranes; exception handling reduction
|
Vision/OCR systems capture container IDs and transaction data automatically, reducing manual checks, clerical error, and mismatches that cause yard churn. | APM Terminals examples: OCR implementation at APM Terminals Aarhus (2024) and OCR integration updates at APM Terminals Gothenburg. | Faster gates and crane processing; fewer data disputes; smoother handoffs to drayage and terminal operating systems. | Lighting/occlusion issues; exception handling still needs humans; integration with TOS and appointment systems drives ROI. |
|
⑨
Stowage planning acceleration via ML lashing-force prediction
Where it shows up: stowage planning offices; rapid iteration under late cargo changes
|
ML models approximate expensive lashing calculations, letting planners iterate faster while keeping safety checks anchored to validated boundaries and class rules. | Peer-reviewed example: “Lashing Force Prediction Model with Multimodal Deep Learning and AutoML for Stowage Planning Automation in Containerships” (C. Lee, Logistics, 2020). | Shorter planning cycles; less rework; better ability to absorb late-booking cargo changes without destabilizing stowage quality. | Validation and conservatism requirements; unacceptable downside if used as a substitute for safety governance rather than an accelerator. |
|
⑩
Predictive ETA from AIS and learned lane behavior
Where it shows up: visibility platforms; berth planning; drayage and warehouse scheduling
|
Models forecast arrival times using AIS trajectories and contextual factors rather than static schedules, improving “arrival confidence” for downstream planning. | Peer-reviewed examples: “Enhancing Prediction Accuracy of Vessel Arrival Times Using Machine Learning Algorithms” (Journal of Marine Science and Engineering, 2024) and “High-accuracy prediction of vessels’ estimated time of arrival…” (2025, AIS + ML). | Better berth and labor planning; fewer missed cutoffs; reduced bullwhip effects in inland legs from surprise arrivals. | AIS gaps and regime shifts (diversions, canal changes, unusual congestion) can degrade accuracy if models aren’t retrained quickly. |
| AI Development | How it works on the ground | Named proof point | Operational impact | Constraint to watch |
|---|---|---|---|---|
|
⑪
Sanctions/compliance screening based on behavior patterns
Where it shows up: trade compliance; chartering vetting; insurer and banking checks
|
Behavioral models flag deceptive shipping indicators (dark activity, AIS manipulation patterns, suspicious STS behavior) so teams prioritize review and document defensible decisions. | Windward vessel-screening materials describe continuous monitoring using behavioral risk models; LSEG press release (2023) describes deploying Windward AI capabilities to combat sanctions-busting across global shipping. | Faster and more consistent triage; reduced inadvertent exposure; stronger audit trails for counterparties and insurers. | False positives; explainability; governance must define what triggers escalation and what gets cleared. |
|
⑫
Emissions intelligence moving from reporting into operations
Where it shows up: just-in-time arrivals; idle-time reduction; voyage/port decision loops
|
AI-driven forecasts and coordination improve port-call timing so ships can reduce idling/over-speeding, linking emissions performance to operational decisions rather than post-voyage reporting. | PortXchange (2025) describes real-time emissions intelligence and just-in-time coordination; Port of Rotterdam provides PortXchange tool context; NAPA and Wärtsilä voyage optimization product lines position operational optimization as fuel/emissions performance levers. | Less fuel burned on “waiting with engines on”; better schedule reliability decisions; more credible efficiency programs tied to actions, not dashboards. | Requires coordination across port, terminal, and carrier; accounting must match what actually changed operationally. |
|
⑬
Customer and ops communications triage at carrier scale
Where it shows up: booking/service desks; exception handling; internal ops message queues
|
AI routes, summarizes, and drafts responses so exceptions don’t get stuck in inbox backlogs. The key value is speed-to-resolution on operational issues, not “chatbots.” | Reuters (Apr 6, 2025): CMA CGM and Mistral AI partnership aimed at customer service and shipping/logistics workflows, referencing handling over a million emails per week. | Faster response times; fewer missed exceptions; improved customer visibility without scaling headcount linearly. | Quality control and escalation rules; sensitive data handling; avoiding “confident but wrong” drafts. |
|
⑭
AI inside carrier logistics arms: forecasting and warehouse planning
Where it shows up: CEVA-style networks; warehouse labor planning; exception prediction
|
AI shifts from “ship-only optimization” into door-to-door logistics nodes, improving forecasting, inventory planning, and warehouse throughput decisions. | Reuters (Jul 18, 2024): CMA CGM partnership with Google to accelerate AI across operations, including routing/container handling/inventory management, with CEVA using AI tools for warehouse forecasting. | Better predictability across nodes; fewer labor surprises; improved service reliability for end-to-end products. | Integration complexity; data silos; benefits muted without process change and clean master data. |
|
⑮
Remote surveys and inspections using drones + AI assistance
Where it shows up: class/surveys; hull and confined-space inspections; reduced staging
|
Drones capture imagery in confined/unsafe spaces; AI supports standardized outputs and reduces intrusive access work, compressing timelines and lowering risk. | DNV expert story dated Feb 1, 2024: REDHUS research project reported successful final onboard tests demonstrating automated remote drone- and AI-based ship hull survey feasibility. | Shorter survey time; fewer staging costs; safer inspection routines; reduced disruption to ship availability. | Standardization and acceptance pathways; connectivity constraints onboard; edge cases still require human judgment. |
Data note: “Named proof point” anchors to a specific public source type (company release/trade coverage) or a specific peer-reviewed paper. Outcomes and ROI still vary by vessel class, lane profile, crew practices, and how tightly tools are embedded into day-to-day workflows.
AI Savings Estimator for Shipping Companies
Estimate annual savings by AI category, then view total savings, payback, and a breakdown you can share.
Baseline: Your operating picture
Inputs
Used to scale savings across the fleet.
If you prefer, treat this as “active” days (exclude long yard stays).
Used for voyage optimization and port-call timing savings.
Used for predictive maintenance and survey/inspection workflow effects.
Used to value downtime avoided (failures, inspection delays, disruptions).
Used for port-call planning and “arrive when ready” effects.
Used to value reduced waiting and improved berth planning.
Includes fuel at idle, crew, consumables, and schedule knock-on cost (use your internal estimate).
Used to value AI lookout and terminal safety analytics (avoidance or reduction in severity).
Direct repair + claims + delay exposure (your internal average).
Used for AI triage in customer and ops communications.
A placeholder bucket for avoidable costs from sanctions/controls issues, extra screening, or delayed decisions.
Software, data, integration, training, managed services (annual run-rate).
Implementation, onboarding, sensors where needed, and internal change work.
This sets starting sliders. You can override each slider after.
Data note: This tool is intentionally assumption-driven. AI outcomes vary by ship type, lane profile, crew practice, port environment, and how tightly the tools are embedded into daily decision-making.
Choose AI categories and set expected impact
Sliders
AI lookout and navigation decision support
Savings source: reduction in incident frequency/severity
Voyage optimization: speed and routing
Savings source: fuel efficiency improvement
Port-call planning and arrival timing
Savings source: reduced waiting time (hours) and smoother schedules
Predictive ETA and arrival confidence
Savings source: fewer missed cutoffs and fewer “rush” recoveries
Predictive maintenance and anomaly detection
Savings source: reduced maintenance spend and reduced off-hire from failures
Terminal automation effects (OCR + safety analytics)
Savings source: fewer terminal-related delays and fewer yard incidents
Stowage planning acceleration and fewer rework cycles
Savings source: reduced planning friction and reduced last-minute operational penalties
Sanctions and compliance screening automation
Savings source: reduced avoidable compliance exposure and faster defensible clearance
Customer and operations message triage
Savings source: reduced customer operations cost and fewer missed exceptions
Remote surveys and inspection workflow efficiency
Savings source: reduced inspection-related off-hire and reduced maintenance disruption
Results
Outputs
Annual gross savings
$0
Total estimated savings before AI program costs.
Annual net savings
$0
Gross savings minus annual AI program cost.
Payback period
—
One-time setup cost divided by annual net savings.
ROI (annual)
—
Annual net savings divided by (annual AI cost + one-time cost).
| AI category | Savings logic used | Annual savings (USD) | What drives results | Primary limitation |
|---|---|---|---|---|
| Run the calculator to populate results. | ||||
This is an estimation tool. Treat results as directional and validate with your internal KPIs (fuel variance, waiting-hour baselines, downtime drivers, claims history, and service KPIs).
We welcome your feedback, suggestions, corrections, and ideas for enhancements. Please click here to get in touch.