Suez Still Avoided
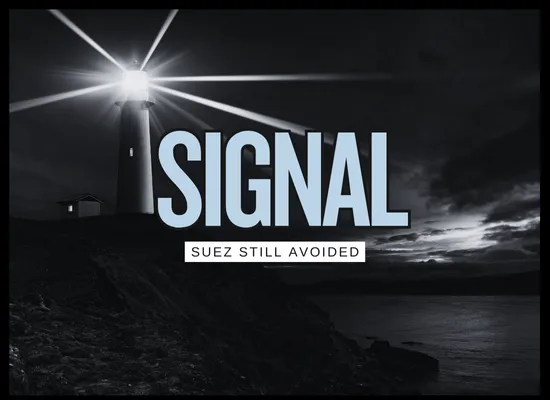
This signal tracks continued avoidance of the Suez/Red Sea corridor in commercial routing, showing up as persistently depressed transits and “Cape default” network behavior rather than a quick return to pre-disruption patterns.
| Indicator | What it captures | What “still avoided” looks like | Operational effect | Flip conditions to watch |
|---|---|---|---|---|
| Transit gap | Distance from prior-year Suez transit levels, by segment. | Transits remain meaningfully below baseline, especially on container services. | Longer loops stay embedded, keeping vessel-days elevated. | Sustained multi-week recovery in container transits (not just one-off test sailings). |
| Routing default | Whether schedules are built assuming Cape or Suez. | Cape routing is still treated as the “normal” plan in network design. | Capacity stays tighter versus a full Suez return; less schedule slack. | Carriers re-publish rotations with Suez baked in, then hold them without reversals. |
| Risk-cost vs behavior | Spread between insurance/risk premiums and actual routing decisions. | Premiums may move, but operational behavior changes slowly. | Commercial planning remains conservative despite price signals. | A visible “behavior catch-up” where routing follows lower risk costs consistently. |
| Schedule recovery | How quickly services can regain reliability once disrupted. | Reliability gains are incremental because longer voyages reduce recovery room. | Late calls cascade more easily across a rotation. | Published reliability metrics improve while route choices remain stable (no mid-season flip-flops). |
| Port bunching risk | Whether a return would compress arrivals into fewer days/weeks. | Transition risk stays elevated if a return happens suddenly. | Short-term congestion risk rises during route normalization. | Managed, staged return signals (phased services) rather than “everyone flips at once.” |
Comprehensive Overview
Suez usage is still depressed, so Cape routing stays “baked in”
The headline number has not shifted: first-week 2026 Suez transits were described as ~60% below the same week in 2023. The operational consequence is that the market is still paying the vessel-day cost of longer voyages, even as war-risk premiums and test transits get attention.
Segment snapshot (Q4 2025 vs 2023, reported)
The split explains why “recovery” looks uneven: tankers have shown more willingness to return than boxships, while container transits remain heavily suppressed.
How far each segment is from 2023 (down %)
Where the friction actually appears
1) Schedule recovery
Longer voyages reduce slack. When one port call slips, it often takes longer to win back time across the rotation.
2) Equipment positioning
Cape loops shift where boxes accumulate and when empties return, which can change local availability even without demand changes.
3) Port bunching risk
A faster-than-expected return to Suez can compress arrivals and stress terminals during the transition period.
4) Contract friction
Routing uncertainty tends to surface in ETAs, delay allocation, and the commercial handling of late deliveries and disruptions.
Normalization lens (container shipping)
BIMCO has estimated that a full normalization of Red Sea and Suez routings could reduce container ship demand by roughly 10%, because shorter voyages free up capacity. The slider below is a simple way to visualize that relationship as a range.
Cape vs Suez Vessel-Day Estimator
A network planning tool: convert “extra days per round trip” into equivalent ships required to keep weekly frequency, plus a simple cost lens. Inputs are yours on purpose so it stays usable across trades and ship sizes.
Ships needed via Suez
11
Loop days ÷ frequency, with buffer.
Ships needed via Cape
13
Longer loop increases ships per string.
Incremental ships
+2
This is the “capacity tax” of diversion.
Extra vessel-days / year
730
Based on the delta in loop days.
Annual cost delta (USD)
$32.9m
Extra vessel-days × cost/day.
Loop delta (days)
14
Cape minus Suez (before buffer).
Bars: ships required (with buffer)