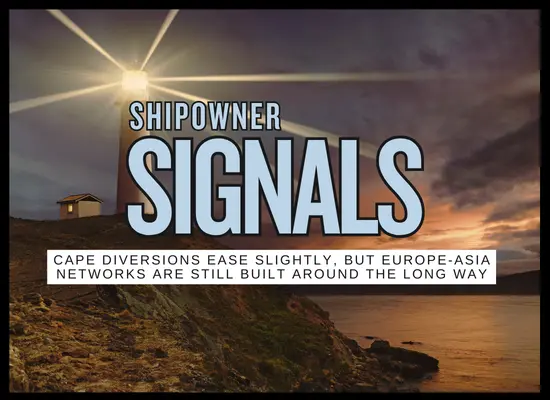
Cape Diversions Ease Slightly, But Europe-Asia Networks Are Still Built Around the Long Way
Drewry’s latest Red Sea Diversion Tracker shows a marginal easing in Cape routings, but not a return to normal Suez usage. In the most recent two-week measurement, Suez transits slipped from 61 to 60, while Cape of Good Hope routings fell 4% to 303, leaving the Cape route still the dominant Asia-Europe path by a wide margin. The signal for shipowners is that effective voyage distance and capacity absorption remain elevated, schedule integrity remains exposed to disruption, and risk and insurance posture stays relevant because carriers are still only selectively testing Suez rather than rebuilding full networks around it.
| Signal piece | Moving | Fast impact path | Operator-facing tell |
|---|---|---|---|
| Suez usage | Suez Canal containership count edged down from 61 to 60 between the two-week periods ended 25 Jan and 8 Feb. | This is not a broad return-to-Suez trend. It signals limited, cautious testing rather than network normalization. | Planners still build primary rotations around Cape transit time, with Suez treated as selective optionality. |
| Cape routings | Containerships sailing around the Cape of Good Hope decreased 4% to 303 in the latest two-week period versus the prior fortnight. | Even with a small easing, Cape remains the dominant Asia-Europe route, keeping voyage distance and effective capacity absorption elevated. | Fleet utilization stays supported by longer voyages, but schedules remain stretched and sensitive to disruption. |
| Large ship testing | CMA CGM, MSC and Maersk were cited as the main carriers sending the largest vessels via Suez in the period, including 8,000 teu plus ships, with one 24,000 teu vessel noted. | Selective high-profile transits influence market psychology, but the scale remains small relative to Cape volumes. | Risk teams and charterers watch peer behavior closely, but do not assume widespread reversion to Suez routing. |
| Partial corridor behavior | Smaller niche carriers were described as sending many sub-8,000 teu ships via the Canal on shorter regional patterns that do not necessarily sail past the highest-risk area. | Routing becomes segmented: regional and partial-corridor moves are not the same as full Asia-Europe normalization. | Operators see mixed patterns: some Suez counts rise without meaningfully reducing Cape reliance for mainline loops. |
| What Drewry tracks next | Drewry notes five indicators in its broader Container Capacity Insight: best case Asia-Europe transit times, port congestion, import dwell times, schedule reliability, and carrier capacity. | The route choice impacts more than miles. It cascades into reliability, congestion, and equipment cycles that can drive costs and claims. | Higher variance in ETA, bunching risk, and connection misses persists while routings remain fluid. |
Comprehensive Overview
Bottom-Line Effect
This is a marginal easing signal, not normalization. Cape diversions dipped, but the level remains very high relative to Suez usage. For shipowners the practical effect remains longer voyage legs, continued capacity absorption, and persistent schedule variability. The key question is whether more large-carrier transits translate into sustained network design changes, or remain isolated tests.
Directional read: what changed, what did not
Bars are directional based on the tracker narrative: small change in counts, but route structure remains primarily Cape-based.
Owner tells to watch next
- Two or more consecutive tracker updates where Suez volumes rise meaningfully and Cape volumes fall materially, not just by a few ships.
- Large carriers expanding Suez usage beyond isolated transits into multiple strings, across alliances.
- Clear improvements in schedule reliability and transit time stability that persist for several weeks.
How this hits operations and costs
- Routing uncertainty increases planning friction, including bunker strategy, speed management, and berth planning.
- Higher schedule variability can lift claims, detention and demurrage disputes, and connection failure costs.
- Insurance posture and security procedures remain relevant while carrier behavior is mixed.
Loop time uplift
+13.0%
Extra days divided by baseline loop time.
Effective capacity absorbed
High
Longer loops typically require more ships to hold frequency.
Operational cue
Bunching risk
Higher loop times can increase schedule compression and port bunching.
This is a simplified lens. Actual absorption depends on speed, port productivity, buffer days, and network design choices.
Source note
Drewry Red Sea Diversion Tracker, assessment for 10 Feb 2026, comparing the two-week periods ended 25 Jan and 8 Feb: Suez Canal containerships 61 to 60, and Cape of Good Hope routings down 4% to 303. Tracker commentary also notes that CMA CGM, MSC and Maersk again sent the largest vessels via Suez in the latest period, including multiple ships above 8,000 teu. Source: Drewry (as carried in a 13 Feb 2026 summary).
We welcome your feedback, suggestions, corrections, and ideas for enhancements. Please click here to get in touch.