Vessel Traffic Rebounds Across Key Global Routes
Subscribe to the Ship Universe Weekly Newsletter
Recent developments in global maritime traffic indicate a cautious resurgence in key shipping corridors. Notably, the Red Sea has experienced a significant uptick in vessel movements following a period of heightened security concerns. Simultaneously, the Panama Canal reports record-breaking container ship transits, reflecting shifts in global trade dynamics.
To navigate these shifting dynamics, operators increasingly rely on tools like Ship Universe’s Canal Cost Calculator to compare fees across key chokepoints and the Shipping Route Risk Tool to visualize threats along specific trade lanes. With trade routes in flux, these resources help shippers balance cost, safety, and reliability in real time.
Red Sea Traffic Rebounds
The Red Sea, a critical artery for international shipping, has seen a 60% increase in daily vessel traffic since August 2024. This rise brings the average to 36–37 ships per day, up from a low of 20–23 ships daily during peak security threats in late 2023. However, this figure remains below the pre-crisis average of 72–75 ships per day.
The improvement follows a ceasefire agreement between the United States and Yemen's Houthi movement, leading to a reduction in missile and drone attacks on commercial vessels. The European Union's naval mission, Operation Aspides, has played a pivotal role in enhancing maritime security in the region. Since its inception, the mission has provided close protection to 476 ships, neutralized 18 aerial drones, destroyed two remote-controlled boats, and intercepted four ballistic missiles.
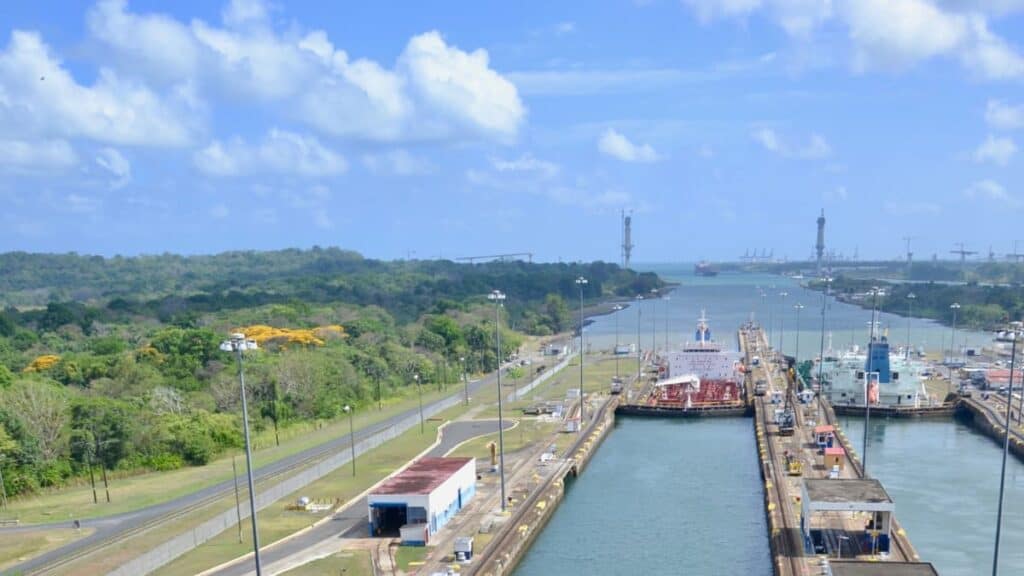
Panama Canal Sets New Records
In contrast to the Red Sea's gradual recovery, the Panama Canal has achieved unprecedented levels of container ship traffic. Between January and May 2025, over 1,200 container ships transited the canal, marking a 10.2% year-over-year increase and a 4.1% improvement over the previous record set in 2022.
A significant contributor to this surge is the increased utilization of Neo Sub-Panamax vessels, defined as ships with a TEU (twenty-foot equivalent unit) capacity between 7,500 and 10,000. These vessels accounted for more than a quarter of all container ship crossings through the canal during this period, recording a 30.2% year-over-year increase.
Shifts in Global Shipping Patterns
The contrasting developments in the Red Sea and Panama Canal highlight a broader shift in global shipping patterns. While security improvements have encouraged a partial return to traditional routes in the Red Sea, the Panama Canal's record traffic suggests a strategic reorientation by shipping companies.
Factors influencing these shifts include:
- Security Concerns: Persistent threats in certain regions have prompted rerouting to safer corridors.
- Operational Efficiency: The Panama Canal offers a shorter transit between the Atlantic and Pacific Oceans, appealing to carriers seeking time and cost savings.
- Vessel Size Optimization: The rise of Neo Sub-Panamax vessels aligns with the canal's capacity, allowing for economies of scale.
Global vessel movements are showing renewed momentum, signaling a more flexible and adaptive maritime industry. The recovery in the Red Sea and record throughput at the Panama Canal reflect shifting patterns and the sector’s ability to recalibrate amid persistent challenges.
Brief summary:
- Red Sea traffic has rebounded as targeted threats narrow and routing confidence improves
- Panama Canal sees surge in Neo-Panamax traffic, driven by drought recovery and trade realignment
- Operators are leveraging real-time tools to assess risk and optimize costs across dynamic trade routes
- Strategic flexibility remains vital as geopolitical and environmental variables continue to evolve
Ongoing vigilance and data-informed decision-making will shape how global shipping responds to the next wave of disruptions and opportunities.