Container Losses Drop Long-Term Despite 2024 Bump
Subscribe to the Ship Universe Weekly Newsletter
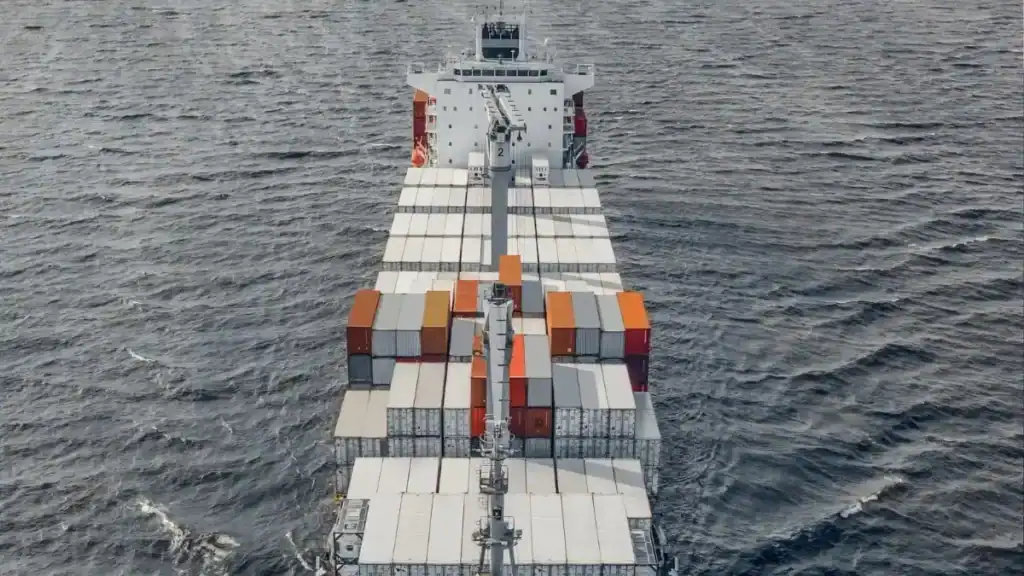
The World Shipping Council (WSC) has released its annual Containers Lost at Sea Report, revealing that 576 containers were lost overboard in 2024. Although this marks a notable increase from the record‑low 221 containers lost in 2023, the total remains significantly below the 10‑year average of 1,274 containers per year.
This update stands out as part of a broader downward trend in container losses over the past few years, underscoring the shipping industry's continued emphasis on improved safety and loss‑prevention protocols.
Major Developments and Data Highlights
- 2024 Losses in perspective
- 576 containers lost across approximately 250 million transported during the year, translating to a fraction of 0.0002 percent of all containers moved globally.
- This level of loss, while up from 2023’s total, remains well below the decade average of 1,274 containers lost annually.
- Impact of route changes from Red Sea disruption
- Conflict-related disruptions in the Red Sea led to a 191 percent spike in vessel transits rerouting around the Cape of Good Hope compared to 2023.
- Approximately 200 container losses occurred near the Cape, accounting for roughly 35 percent of the global total for 2024.
- Historical context
- The 576‑container loss is more than double 2023’s figure, but still much lower than peaks seen in other years—for example, over 5,500 lost in 2013 and nearly 4,000 in 2020 .
- A rolling three‑year average covering 2022–2024 stands at 489 containers, a drop from 1,061 in the prior period (2021–2023).
Why This Increase Happened
- Avoidance of Red Sea conflict zones forced vessels into longer, riskier routes around the Cape of Good Hope, where hazardous weather conditions prevail and increase the chances of containers overturning or falling overboard.
- Seasonal storm exposure
Ships that might not normally navigate the Cape’s demanding conditions were exposed to severe weather—especially during winter months—contributing to elevated risk . - Route volume shift
The sharp rise in traffic through the region meant more vessels were exposed to the same challenging maritime environment, concentrating vessel incidents in that area .
Ongoing Measures and Safety Initiatives
Despite the increase, the shipping industry continues proactive work across multiple fronts to reduce future losses:
Mandatory Reporting in 2026
New SOLAS amendments require mandatory reporting of containers lost at sea starting January 1, 2026. WSC has supported these regulations and intends to stay transparent and consistent in its own reporting leading up to then.
Top Tier Joint Industry Project
Led by MARIN with WSC participation, this project will deliver its final report to the IMO in September 2025, offering insights and recommended updates to container safety regulations and handling standards .
Cargo Safety Program Launching 2025
The WSC Cargo Safety Program introduces an industry-wide cargo screening system to address misdeclared or undeclared dangerous goods identified as a leading source of onboard fires and container losses.
New Standards for Charcoal Shipments
Spurred by fire risk concerns, regulations classifying charcoal as dangerous goods will take effect in 2026. Many carriers are already adopting these measures proactively in 2025.
Why the Numbers Still Signal Progress
- Very low loss rate
Even with 576 containers lost, the ratio remains just 0.0002 percent of annual container throughput—highlighting overall operational safety. - Transparency and data quality
The report is built on direct input from WSC members representing nearly 90 percent of global container vessel capacity, then extrapolated to create an industry-wide estimate. - Continuous decline trend
Losses in recent years are far below historical peaks; 2024 stands out as low compared to past decades—even with the increase. - Recovery gains
For the second year in a row, the WSC included container recoveries in its report. In 2024, two of the lost containers were recovered, though every loss remains unacceptable.
Despite the uptick in total losses in 2024, the overall pattern shows that container transport remains extremely safe by historical standards. Continued emphasis on transparency, reporting, and preventive initiatives reinforces that even rare losses are taken seriously. Mandatory reporting, cargo screening systems, and collaborative projects will further reduce risk in the years ahead.
The 2024 report signals both the tangible impact of route shifts due to geopolitical disruption and the industry's capacity to learn, adapt, and strengthen safety over time. 在Shipping moving forward, every container loss remains an avoidable incident—one warranting constant vigilance and continuous improvement.