Suez Return Playbook 2026: Who Re-enters, Who Stays Cape, and the Capacity Math
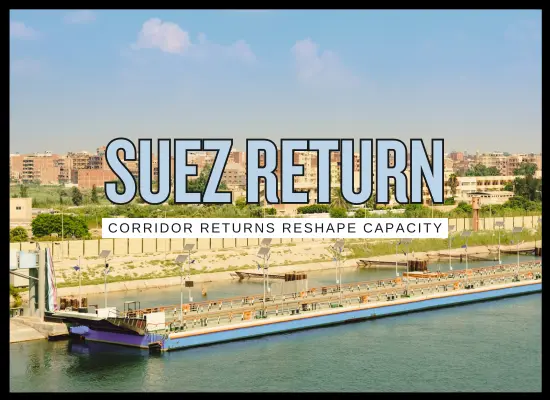
The Suez return is starting to look less like a single “all clear” moment and more like a service-by-service test: one confirmed structural re-entry, a few selective bets, and several carriers keeping Cape routing as the default until risk and insurance feel boring again.
1️⃣ Who Re-enters
Re-entry is not about public optimism. It is about which specific loops a carrier is willing to commit to routing through Suez and the Red Sea on a repeatable schedule, and what conditions would make them flip back to Cape with little notice.
| Re-entry move | Carrier | Service and trade | Earliest stated start | Routing stance described publicly | Operational implication | What would flip it back |
|---|---|---|---|---|---|---|
|
①
Structural return of a weekly loop via Suez
This is the cleanest example of “re-entry” because it is described as a repeatable routing change, not a one-off transit.
Confirmed
Service-level
|
Maersk | MECL (Middle East and India to U.S. East Coast) | Cornelia Maersk westbound described as departing Salalah on Jan 26, 2026 (service routing shift also described with voyage references on Maersk notices). | Maersk describes a “structural return” of the MECL service to the trans-Suez route for all MECL sailings, with westbound and eastbound routing shifts referenced by voyage. | If it sticks, this reduces the number of ships needed to run the loop versus Cape routing and improves schedule math for this specific trade. | Any renewed attack cadence, credible escalation alerts, or a change in escort posture that raises war-risk/insurance friction enough to overwhelm the time and capacity benefits. |
|
②
Gemini-linked follow-on return, reported for a joint service
This is presented in trade reporting as a partner-aligned decision, not a broad network reset.
Reported
Partner-dependent
|
Hapag-Lloyd (with Maersk) | ME11 (reported as a Gemini Cooperation joint service move) | Reported as following Maersk’s MECL return (timing framed as “set for return” in January 2026 reporting). | Reported understanding that the joint ME11 would follow the trans-Suez routing direction after MECL, implying a controlled re-entry on a defined service rather than a full-scale reversion. | If confirmed and executed, it signals that re-entry can propagate from one service to another inside a network plan, but still remains reversible at the service level. | Same trigger set as above, plus internal partner alignment risk: even if one party is comfortable, the joint service routing is only as stable as the shared risk view. |
|
③
Selective re-entry, then selective pullback on other loops
This is the “mixed posture” pattern: some services attempt Suez, while other named services revert to Cape due to uncertainty.
Mixed posture
Route-by-route
|
CMA CGM | INDAMEX described in trade reporting as a full-loop return (earlier January 2026), while other named Asia–Europe services are described as diverting away from Suez. | INDAMEX return described in reporting from mid-January 2026; Reporting (Jan 20, 2026) describes diversions on FAL1, FAL3, and MEX away from the Suez Canal. | CMA CGM will divert ships away from Suez on three services due to a “complex and uncertain international context,” indicating re-entry is not uniform across the network. | For shippers, the headline is variability: even if one loop is willing to run Suez, other loops can remain Cape, and service strings can change quickly as risk posture changes. | The same core risk triggers, plus internal risk management posture. The reported rationale is uncertainty, which can persist even without a single defining incident. |
2️⃣ Who Stays Cape
Cape routing is still the default posture for a big slice of the mainline container network because carriers are optimizing for repeatability: they would rather lock in longer transit times they can plan around than bounce between Suez and Cape based on headlines. The key detail for 2026 is that many networks are publishing Cape-based rotations with a “Suez-ready” version held in reserve, which tells you they are preparing for a switch but not committing to it yet.
| Carrier or network | Cape posture described publicly | Where it applies | How firm is it | Stated rationale | Switch trigger | Planning impact |
|---|---|---|---|---|---|---|
Ocean Alliance network (product planning) |
Cape routing retained as the network baseline, with Suez options outlined but not activated as the default. | East–West network planning communicated for 2026 products; network-wide posture rather than a single loop. | Cape-first baseline Suez-ready option | Uncertainty around sustainable safety and operating stability through the Red Sea corridor. | A sustained stability period plus a clear internal green-light for crews, vessels, and cargo risk acceptance. | Transit-time assumptions stay longer; planning improves because schedules do not flip weekly, but inventory and buffer-day models remain “Cape sized.” |
OOCL (network update) |
Vessels continue to be diverted via the Cape “for now,” with an alternate Suez version prepared for certain routes. | Multiple applicable routes in the 2026 product line-up; Suez rotations are described as prepared but subject to further notice. | Cape active Suez rotation drafted | Ongoing uncertainties in the Red Sea region and safety priority for crews, cargo, and vessels. | Company notice enabling the Suez version for specific strings once conditions meet internal safety thresholds. | Shippers should treat any Suez version as a “planned option,” not the schedule they can bank on until activated. |
CMA CGM (named services) |
Three major services are rerouted via the Cape of Good Hope after a brief period of limited Suez usage. | FAL1, FAL3, and MEX service strings connecting Asia and Europe / Med-linked coverage. | Service-specific instruction Active reroute | A “complex and uncertain international context” is cited in the customer-facing decision language. | Clear de-risking in the corridor plus confidence that re-entry will not produce rapid reversals that damage schedule credibility. | Expect longer transit times on those loops, and keep an eye on blanking and buffer-day policy as the carrier manages fleet positioning. |
ONE (East–West network update) |
Published 2026 port rotations are based on current routing via the Cape of Good Hope while monitoring conditions. | East–West services in the updated 2026 network; described as a planning baseline aligned to current conditions. | Cape-based planning Monitoring posture | Ongoing evaluation of the security picture, with Cape routing used for continuity and schedule planning. | A decision to resume Suez transits once conditions are viewed as sustainably safe and operationally stable. | Network design and transshipment windows are set with Cape sailing times, which reduces surprise but keeps lead times longer. |
Hapag-Lloyd (Gemini Cooperation posture) |
Gemini launched with a Cape of Good Hope network, and the company states there is no specific timing to shift the East–West network back through the Red Sea. | Gemini East–West network baseline; service-level returns may occur over time, but the network posture is described as not yet time-bound for a corridor switch. | No timing stated Return plan exists | Safety priority and need for sustained security conditions before changing the network routing through the Red Sea. | “Sustainably safe” conditions and tangible stability signals, not a short-term lull. | Shippers should treat Cape as the network assumption for planning and contract timing until a formal network switch is announced. |
3️⃣ The Capacity Math
The capacity math is where the Suez question stops being a headline and turns into fleet availability. When a weekly loop has to run Cape, the extra sailing time translates directly into extra ships required to keep the same departure rhythm, which is why even a partial return to Suez can feel like “new capacity” showing up without a single newbuild being delivered. (Public summaries repeatedly frame the Cape diversion as adding about 10 days or more on key East West routings, and about 3,000+ nautical miles on Asia to Northwest Europe, depending on port pair and speed.)
| Corridor archetype | Commonly cited Cape impact | Distance signal | Weekly loop ship-count impact | Market effect | Why ranges vary |
|---|---|---|---|---|---|
| Asia to Northwest Europe | Public summaries commonly frame Cape diversions as adding about 10 days of sailing time on this routing, with broader averages cited as 10 days or more. | Public commentary frequently cites more than 3,000 nautical miles saved by Suez on this corridor, depending on port pair and speed. | Typical outcome: +1 to +3 ships per weekly loop, depending on whether the loop sits near a 7-day multiple. | Effective capacity is absorbed when loops add ships, tightening available tonnage and keeping rates more resilient than demand alone would imply. | Speed policy, port intensity (number of calls), waiting time, and how much buffer is baked into the schedule. |
| Asia to Mediterranean | Often similar directionally to Asia–North Europe, but the exact day impact varies with port rotation length and whether the service leans hub-heavy or direct-heavy. | Distance and day deltas depend strongly on whether the string touches multiple Med ports or concentrates on a few hubs. | Typical outcome: +1 to +3 ships per weekly loop, with bigger jumps when the service is already near the next ship-count threshold. | The knock-on effect shows up as tighter vessel availability and more blanking discipline when carriers are trying to protect schedule credibility. | Med rotations often have more call variability, which increases the buffer required for weekly consistency. |
| Middle East and India to U.S. East Coast | Distance examples for Suez vs Cape show meaningful increases via Cape on long-haul routings, with week-plus delays cited in some analyses, depending on port pair and speed. | Port-pair examples show thousands of nautical miles difference when routing changes, which translates into days that add up across a full loop. | Typical outcome: +1 to +2 ships for weekly loops, but can be higher for call-heavy strings with tighter schedule promises. | Services that can shift back to Suez reduce the ship count needed for the same frequency, effectively releasing ships to other trades or improving schedule stability. | U.S. East Coast port time and berth windows often dominate, so sea-time savings do not always translate one-for-one into lower ship count. |
| Average supply chain timing signal | Global summaries describe diversions around the Cape as increasing delivery times by 10 days or more on average during the disruption period. | This is a timing signal rather than a single corridor distance figure. | The ship-count effect depends on where the loop lands relative to the 7-day thresholds, so two services with the same extra days can have different ship-count outcomes. | This is why the market can feel tight even when demand is flat, because ship-count thresholds convert time into capacity very abruptly. | Threshold effects: crossing from 11 ships to 12 ships is a step change, not a smooth curve. |
Suez in 2026 is less about a single “reopen” moment and more about whether carriers can keep specific loops running through the corridor without having to reverse course a week later. If the returns broaden, the biggest impact will show up quietly in the capacity math, fewer ships tied up per weekly service, tighter or looser vessel availability, and a shift in how much buffer time shippers build into their plans. If the corridor stays uncertain, Cape routing remains the stable baseline and the market keeps paying for extra sailing days in the form of longer lead times and more fragile schedules.
We welcome your feedback, suggestions, corrections, and ideas for enhancements. Please click here to get in touch.